Studies suggest that there are differences in attitudes towards social welfare between men and women. Women seem to rely more on support from the government than men do. According to Lewis (1998), women seem to accord more importance to social welfare problems than men, specifically when touching individuals in need, or making use of the welfare system, for instance. Therefore, in this paper, I will ask if there is an association between attitudes towards social welfare and gender?
Before conducting any data analysis, several hypotheses arose from what I expected from the results:
H1: Men are less supportive than women when it comes to social welfare.
H2: Socioeconomic components, such as income, impact the association between attitudes towards social welfare and gender.
H3: The impact of income on attitudes towards social welfare will be stronger for individuals coming from the ethnic majority (White) than for individuals from an ethnic minority.
In order to conduct my data analysis, results will be analysed from statistical tests carried out in IMB SPSS Statistics 25, by analysing the data from the British Social Attitudes Survey 2010. This specific wave of the Survey focuses on topics such as attitudes towards education and welfare. To carry out the survey, a questionnaire was used, with a self-completion part and an administered part. The wave of the survey used in this data analysis contains the attitudes of 3297 participants selected using a random sampling method, and a dataset comprising 878 variables in total.
As different variables seemed to be covering the topic of social welfare, an outcome variable was created manually by using the cumulative effect of four different variables from the dataset to be used as a dependent variable. This manually created variable was named ‘social welfare attitudes’, or ‘SWAT’. The four variables used all have questions and results that seem to touch on the issue of social welfare towards the ones in need, which is what this paper primarily examines. All four variables are measured on the same five-point Likert Scale, making them all continuous interval variables that can be cumulated together. All variables were coded as follows:
‘Agree Strongly’
‘Agree’
‘Neither Agree nor Disagree’
‘Disagree’
‘Disagree Strongly’
Consequently, all variables with low numbers represent a negative attitude towards social welfare, while the high numbers suggest a more positive attitude. This coding was maintained as it was in complete accordance with the objectives of the data analysis. The four cumulated variables are:
WelfHelp: stating that ‘the welfare state encourages people to stop helping each other’.
SocHelp: stating that ‘many people who get social security do not really deserve help’.
DoleFidl: stating that ‘most people on the dole are fiddling in one way or another’.
WelfFeet: stating that ‘if welfare benefits were not so generous, people would learn how to stand on own feet’.
These four variables seem to measure one unique aspect of individuals’ attitudes towards social welfare. However, before making the dependent variable by cumulating the four variables listed above, it is crucial to see if there is a correlation between these variables. If so, it is necessary to then do a factor analysis so as to ensure that they all cover a broad enough dimension related to attitudes and to reduce the variables into a fewer number of dimensions.

Looking at Table 1, the variables all seem to be correlating positively. Indeed, correlations fluctuated from 0.473 to 0.669, which are moderate and strong correlation scores. The existence of such positive correlation then allowed the running of a factor analysis.

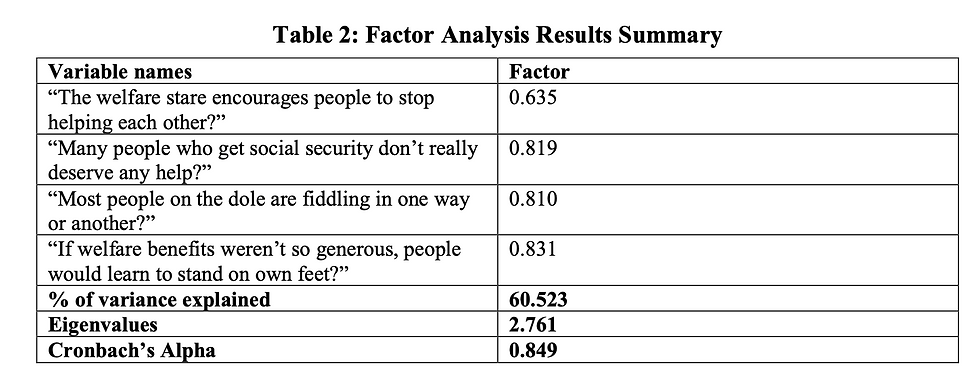
According to the result of the factor analysis that was run above, my expectations are supported and Table 2 reveals that there is only one underlying factor behind four analysed items. Looking at Table 2, it is clear that all variables have especially high factors fluctuating from 0.635 to 0.831. As a result, it is not necessary to rotate the factor solution as the interpretation of this specific structure is simple enough, allowing us to see the shared underscoring dimensions of the variables, that all loaded well with one unique concept. The results also show an eigenvalue score of 2.761, showing how much of the variance between the variables was explained by the explanatory factor analysis.

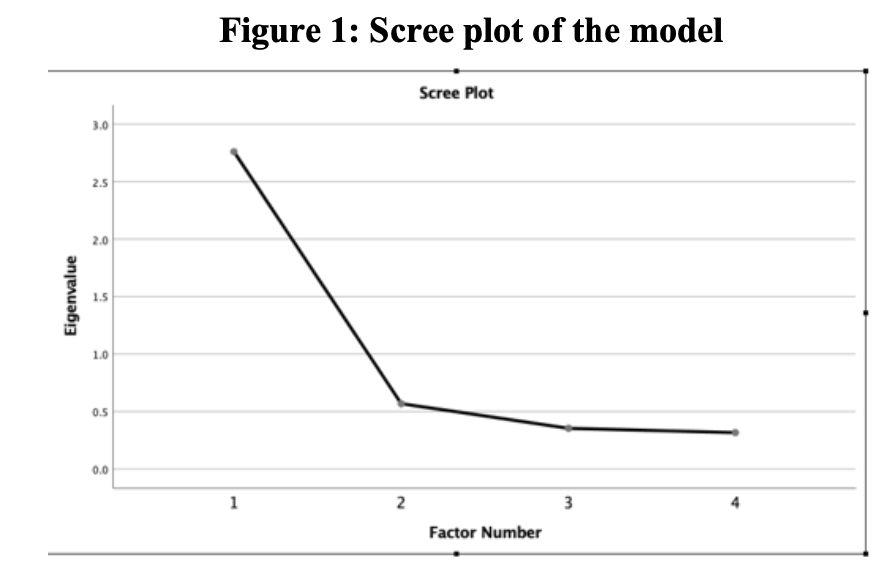
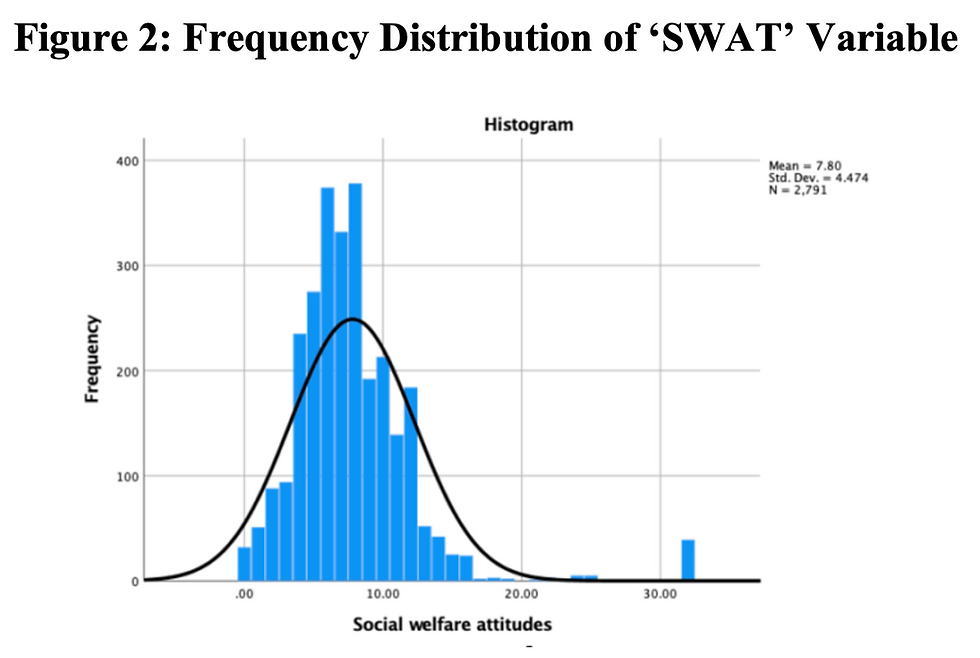
Furthermore, even though certain factors seem to have been extracted, according to Table 2, only one factor has eigenvalues superior to 1, meaning that this factor was saved, as other factors with low eigenvalues were not meaningful and therefore were not used in our model and scree plot (Figure 1). 60.5% of the cumulative percentage of variance is accounted for by that factor. In addition, the Cronbach’s Alpha for the four variables is of 85%, which suggests that the items have relatively high internal consistency and are hence dependable enough to be used as scale. With the results of explanatory factor analysis conducted above, it is thus appropriate to create a new summated scale using the four items, and thus, the new variable ‘SWAT’ was created to be used as a dependent variable in my subsequent model. Figure 2 is a histogram of the computed variable’s frequency distribution, which relatively follows a normal distribution, aside from the small number of people who seem to have chosen the most extreme responses in every question. Therefore, Figure 2 seem to be illustrating the fact that the dependant variable is reliable enough to use in a linear regression model.

Aside from the manually created dependant variable ‘SWAT’, my models will also be considering the participants’ age, gender, ethnicity, level of education and income. Since the main emphasis of this study is gender, other demographic variables such as age, ethnicity, level of education and income are to be considered as covariates and control factors in this study.
The variable for gender is to be recoded 1 for male and 0 for female as to satisfy the purpose of this study.
Age is a continuous variable with ages ranging from 17 to 95. No further coding seems to be needed in this case.
Ethnicity was initially constituted of eleven different categories, with several groups, including ‘Asians’, ‘Blacks’, ‘Mixed’ and ‘Whites’. To make the study easier, a dummy variable was created as to see if the participant is part of the ethnic majority (white) or ethnic minority (black, Asian, mixed and other minority ethnicities). Therefore, the ethnic majority was coded 0 and the minority coded 1.
Education is initially constituted of seven categories referring to different levels of education going from 1-‘Degree’ to 7-‘No qualifications’. As to make the study and its interpretation easier, the variable is to be recoded into a new scale in which 1 corresponds to ‘No qualifications’ and 6 to ‘degree’. The category entitled ‘foreign qualification or other’ was voluntarily recoded as missing values as it would have been hard to interpret or make sense of, or find a UK equivalents for.
Income is a variable with values from one to ten, categorising the participants’ earnings per month going from 1 ‘less than £430 per month’ to 10 ‘£3.601 or more per month’. The same coding is maintained.
To test my various hypotheses and examine whether gender differences in the attitudes towards social welfare will remain significant when controlling for the different socioeconomic factors listed above, multiple nested models will be created. Age, ethnicity and education are to be considered as antecedent variables and incorporated in the models as they could affect the findings if they are not controlled for. Models are the following:
Model 1: SWAT= gender + (age + education + ethnicity)
Model 2: SWAT= gender + (age + education + ethnicity) + income
Model 3. SWAT= gender + (age + education + ethnicity) + income +education*income
I anticipated that gender will directly affect attitudes towards social welfare, whilst this effect will explained to some extent through income, which is anticipated to be a mediating variable. The interaction between education and income will be included in the model. It was also anticipated that individuals with a higher educational background will have a more pejorative view towards social welfare as compared to individuals with lower educational backgrounds, due to the biased ideas of individuals with a low educational background in society. The study’s anticipations are summarised in this model:

The predictors included seem to account for 0.7% of the variance in attitudes towards social welfare in our first, second and third model.
Model 1
The participants’ gender, education level, age, and their ethnicity seems to explain 0.7% of the total variance in attitudes towards social welfare as illustrated by the r2 value. The constant is 7.040 which illustrates that the prediction made about attitudes towards social welfare is 7.040 on the scale when all independent variables take the value of zero. The t-test is 17.879 and is statistically significant. Consequently, it is very unlikely that the constant in the general population is 0. Gender seems to indicate that males score an average -0.503 less than females on the attitude scale when controlling for other variables in the table. This relationship is statistically significant. Therefore, being of the male sex is associated with holding less positive attitudes, and these findings can be generalised to the British population. The first model thus seems to support the first hypothesis that there is a gender difference in social attitudes.

Furthermore, from looking at Table 3, all other factors presented impact formation of more positive attitudes. As participants are getting older for example, they seem to become slightly more supportive of social welfare (0.016). This also goes for individuals with a higher education and those from ethnic minorities, who seem to also have more negative attitudes. Age is statistically significant and the results for age can thus be applied to the general population. The results for the educational level and ethnicity of the participants’ do not allow the findings to be generalised to wider population as the p-value is greater than 0.05. Although not statistically significant, ethnicity seems to be the best predictor according to this model as its standardised coefficient beta value is the highest (0.474).
Model 2:
When including income in the second model, the predictor still accounts for 0.7% of the variance in attitudes. Looking at the results for income, it seems that a rise in earnings has a slightly negative impact on attitudes. Indeed, the more people earn, the less supportive they become (-0.004). This result is however not statistically significant and cannot be applied to the general population. A gender difference still seems to exist with males scoring on average -0.493 lower than females on the attitude scale. The direct positive effect of gender on attitudes is thus still present. The second model thus seems to support my first hypothesis as there is still a gender difference in attitudes. However, as gender is still significant after income has been introduced into the model, with no major changes in the gender coefficient, the effect of gender on attitudes does not seems be mediated through income, as the coefficient for gender changes, which contrasts with what was anticipated in our second hypothesis.
Model 3:
In the third model, interaction between income and ethnicity was added into the regression analysis. The percentage of variance in attitudes is still the same, with a low 0.7%. Gender is still significant and thus still illustrates the fact that there seems to be a clear difference between British women and men in attitudes, which is, according to the still statistically significant finding, a true and valid claim to make for the general population in Britain. Age remains significant too, while education, ethnicity and income remain insignificant, illustrating that the added interaction term did not have any impact on their relations with attitudes. The interaction term is however not statistically significant as its p-value is 0.250 (>0.05), which means that the effect of income on attitudes toward social welfare is the same among different ethnic groups (between the ethnic majority of ‘whites’ and ethnic minorities). However, if the interaction term was statistically significant, including the interaction term that according to the level of income, differences in attitudes occur between ethnic minorities and the ethnic majority. Therefore, with an increase in earnings individuals from ethnic minorities on average become slightly less supportive of the social welfare than individuals from the ethnic majority (white) with the same income, when controlling for all other variables in the table. Thus, the effect of income onto attitudes would be stronger for ethnic minorities than for the ethnic majority, which contradicts my original hypothesis.
Now to have an even closer look at the association between gender and social attitudes, I shall produce a binary logistic regression. To do so, the variable stating that ‘many people who get social security do not really deserve help’, or ‘SocHelp’, will be recoded into a binary variable. Originally, the variable was coded with 5 different categories: 1- ‘Agree strongly’, 2- ‘Agree’, 3- ‘Neither agree nor disagree’, 4- ‘Disagree’, 5- ‘Disagree strongly’. It should be noted that the category ‘Neither agree nor disagree’ was intentionally excluded from the analysis and coded as missing as it does not fall into the objectives of this paper, as we are looking for opinions and not neutrality here. The variable should thus be recoded with 0- ‘Disagree’ and 1- ‘Agree’. As for the independent variables, the same variables of gender, age, education, ethnicity and income will be used to draw more specific conclusions regarding one specific question regarding attitudes, using the variable SocHelp. The same nested models used in the OLS regression will be used here.

Model 1:
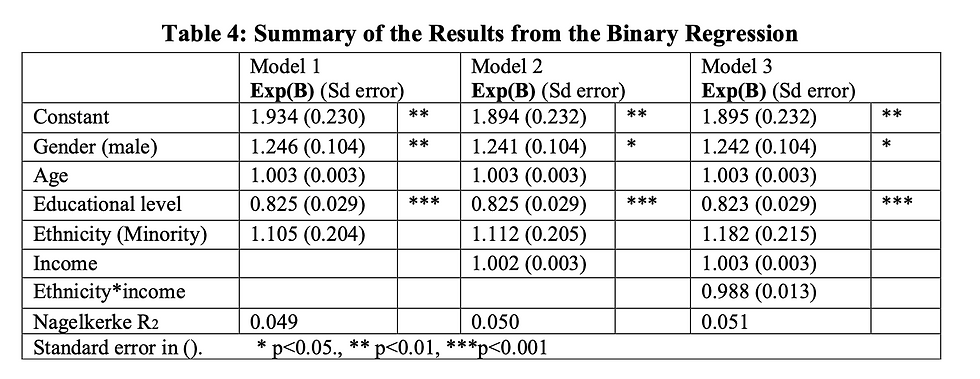
From Table 4, we can see that for our first model, the predictors included seem to account for 4.9% of the variance in attitudes. Gender and education added significantly to the prediction/model, but age, and ethnicity did not add significantly to the model. Table 4 seems to show that the odds of agreeing to the statement ‘many people who get social security do not really deserve help’ is 1.246 greater for males than females. A better education level also seems to be associated with an increased likelihood to agree to such a statement. Therefore, for each increase of 1 on the scale of SocHelp, the odds of men agreeing compared to women increase by 25%, and odds of having a higher education when agreeing to the statement compared to lower education levels decreases by 1-0.825 = 0.175, or 17.5%. Both these probabilities can be applied to the general population as both are statistically significant. Although not statistically significant and thus not generalisable to the global population, we also notice that with a one unit increase in age the odds of scoring 1 increase by 0.3%, so as people grow older, their odds grow a little bit, thus older people seem to be more likely to agree with the statement. Similarly, although also not statistically significant, it seems that for each increase of 1 on the scale of the statement, the odds of ethnic minority individuals agreeing as compared to ethnic majority individuals (white) increase by 10.5%. So, if the results for gender seem to still show that there is a significant difference between men and women when looking at attitudes, thus supporting my first hypothesis, people from ethnic minorities seem to have more negative attitudes than the ethnic majority which still contradicts one of my original hypotheses.
Model 2
According to the second model, the predicators included seem to account for 5.0% of the variance in attitudes, which is slightly higher than in our first model. The inclusion of income seems to reveal that with a one unit increase in income, the odds of scoring 1 increase by 0.2%. Thus, as participants become richer, their odds seem to grow a little, and richer individuals thus seem to be more likely to agree with the statement and therefore have more negative views towards social welfare. This finding is however statistically insignificant meaning that it cannot be generalised to the general population in Britain.
Gender and education still seem to have a probable impact on attitudes as both are still statistically significant. When income is added to the model there are no major changes suggesting that income is still not mediating between gender and attitudes. Age and ethnicity seem to still be statistically insignificant, with the coefficient changing slightly with the addition of income in the model. Therefore, income does not seem to mediate or be an intervening factor between gender, its covariates and attitudes.
Model 3
The third model incorporates the variables from the models above, with the additional interaction variable of ‘ethnicity_income’, in order to see if the effect that was noticed on ethnicity remained the same with different incomes. Though the percentage is still very low, this model seems to explain more variance in attitudes compared to the previous model, accounting for 5.1%. Therefore, although the increase is very small, the new variable added more explanatory power to the third model. The third model still seems to support my first hypothesis as gender is still significant. Thus, we can state that it is likely that there is indeed a difference between men and women in their attitudes towards the fact that ‘many people who get social security do not really deserve help’. In addition, as gender is still significant, the claim is therefore generalisable to the population of Britain. The interaction term is, however, not statistically significant which means that the effect of income on the social welfare variable is the same among different ethnic groups. The control variable ‘education’ is still significant, and its coefficient has slightly changed by 0.002, which would have indicated an impact from the interaction term if it was significant in its relationship with attitudes.
Conclusion: It was therefore established that there seems to generally be a gender difference and gap in attitudes towards social welfare between men and women in Britain. However, this difference does not seem to have been explained through income like we anticipated. Even though it is not statistically significant in the OLS regression, education still seems to be the best predicator of attitudes towards social welfare. Furthermore, there seems to be no statistically significant interaction term, which suggests that the effect of income on the attitudes is the same among different ethnic groups. Even when narrowing the analysis to one specific social welfare variable and running a binary logistic regression to look at the probable effect in the population, there is still a significant difference in gender when looking at attitudes. Therefore, we can say that there is a clear association between gender and attitudes towards social welfare, and more specifically, that men seem to have more negative views than women. Gender thus seems to have a stronger influence on attitudes than socioeconomic factors such as income. However, even if the analysis provided some results on the formation of British attitudes towards social welfare, the study’s scale is small, and further research will be needed to analyse the topic in more in depth.
References
Lewis J (1998) Gender, Social Care and Welfare State Restructuring in Europe. Aldershot: Ashgate
Comments